As every history student knows, the primary elements of American government can be traced to the Constitution. The executive branch, our system of courts, the Congress, so much of government and political power as we know them are described in this one founding document and its postscript, the Bill of Rights. But not political parties. Elections, yes, but the organizations that support a person as they stand or run for office? Not even mentioned.
The Federalist Papers use the words party and parties but not exactly in the modern sense of an organized political party. Just as often they are discussing partisanship and the mere act of side-taking. In any case, they take a negative view of “parties.” James Madison, who elsewhere had spoken in favor of parties, wrote in No. 10 that a “zeal for different opinions concerning religion, concerning government, and many other points . . . have, in turn, divided mankind into parties, inflamed them with mutual animosity, and rendered them much more disposed to vex and oppress each other, than to co-operate for their common good.” (In his 1796 farewell address, President Washington, too, warned against the excesses of “party spirit.”)
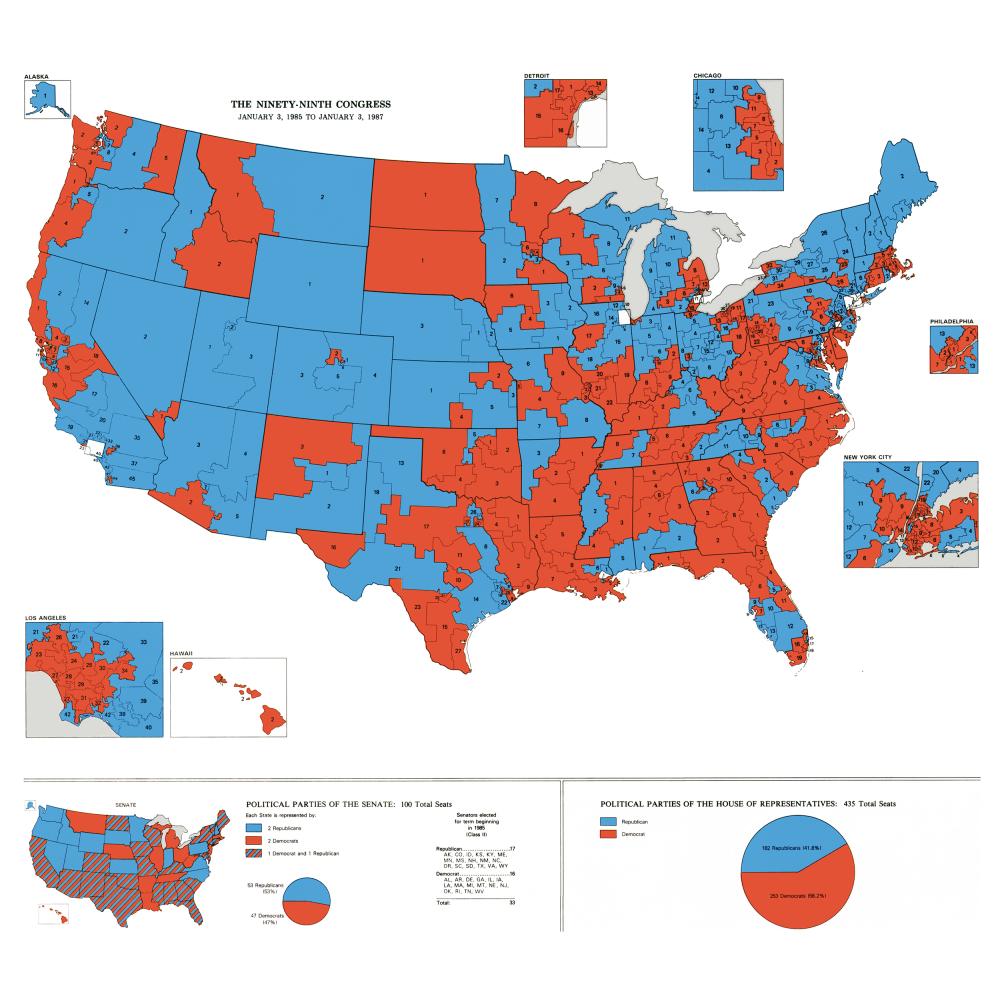
Nor were parties in vogue on the first day of the first Congress in New York City in March of 1789. Yet within a few decades there were, indeed, parties: conventions and platforms, party leaders and party lines, the whole shebang. American political parties would by then seem natural, inevitable, and even necessary. The success of parties in elections, as they captured districts and states, could even be visualized on a map and used to show the distribution of political power and sentiment nationwide. This was done, quite rigorously, many years later, by political geographer Kenneth C. Martis in The Historical Atlas of Political Parties in the United States Congress: 1789–1989.
A big book for a big story, The Historical Atlas of Political Parties, published in 1989, measures more than a foot tall and a foot and a half wide, built to accommodate generously sized U.S. maps with each state carved into congressional districts. With one national map for each Congress, the atlas is a wonderfully detailed flip book of party development and competition. America’s history of political parties cannot be told in maps alone, however, so there is also a large amount of text.
The earliest members of Congress were self-nominated. A prominent man would take out an ad in the paper or otherwise announce his own candidacy. If he was sufficiently popular, he might face no opponent. States made their own decisions about when to hold elections, with some doing so long in advance of the next congressional term and others shortly before. Since the Constitution didn’t prescribe geographical districts for members of the House of Representatives, states didn’t always designate districts for them to represent. Connecticut, New Hampshire, New Jersey, and Pennsylvania all sent their allotted number of members as a general ticket to the first Congress. Not until 1842 would Congress pass a law requiring that members of the House represent geographically distinct districts and, even then, it would not become settled law until the 1960s.
The first couple of congresses took place in what has been called a no-party period. Which is not to say that members of Congress did not take sides. Blocs and factions formed, their divisions anticipated by the debates between federalists and anti-federalists over the Constitution. There was also a definite polarity of feeling in regard to administration policy, meaning the leadership of President Washington and Treasury Secretary Alexander Hamilton, which could be measured in the votes congressmen cast, but there wasn’t a whole lot of us-and-them. By comparison, the 1800 presidential election would seem remarkably partisan. Its outcome—the Republican Jefferson defeated the incumbent, Federalist John Adams—foreshadowed the eventual disappearance of the Federalist party from American politics.
Thus began a period of increasing Republican dominance that reached its high point in the so-called Era of Good Feelings, starting around 1816. (Republican here means Republican in a Jeffersonian mold, quite different from the party that later elects President Lincoln.) So dominant was the Republican party that, in 1820, its presidential caucus was open to all members of Congress, regardless of party. President James Monroe ran for reelection unopposed, the last time a candidate for president faced no challenger. This marked the end of what Martis and others call the first era of political parties. In the meantime, a country of 13 states, fewer than 3.9 million people, and 65 seats in the House of Representatives had grown to 23 states, 9.6 million people, and 186 seats at the beginning of the 16th Congress.
Party development accelerated in reaction to the 1824 and 1828 elections. In the first, no candidate for president in the four-way race won more than 50 percent of the popular or electoral vote, sending the decision to the House of Representatives. There, a majority of Adams men or Adams Republicans awarded the presidency to John Quincy Adams, whose popular and electoral vote totals had been second to those of Andrew Jackson, also nominally a Republican or a Democrat-Republican.
Accusations of a corrupt bargain between Adams and Henry Clay, the fourth-place finisher in the general election who had thrown his support to Adams, fed the rancor of Jacksonians, who in the midterm election came to control the House and the Senate. This was the first time both houses of Congress were controlled by a party opposite that of the White House. Jackson himself, of course, avenged his own honor with a landslide victory in the 1828 election, marking the beginning of a new historical era, during which Jackson’s Democrat-Republicans increasingly referred to themselves as simply Democrats.
The dynamics of political parties began to change. “The new groups were coalitions forming around men,” writes Martis, “whereas the old Federalist and Republican parties had originally formed around ideas, especially ideological interpretations of the Constitution.”
Between Jackson’s first term and the Civil War, parties evolved from coalitions of the likeminded into organizations focused on winning elections as several new political parties sprang to life. Founded in 1829 in western New York state, the Anti-Masonic party became the first true “third” party in American history. In 1831, they convened the first national presidential nominating convention. Born of hostility to the socially influential Freemasons, the Anti-Masonics were inspired by the disappearance of William Morgan, author of a manuscript claiming to expose the group’s secret activities. A mostly anti-Jackson party, the Anti-Masonics claimed 25 House seats from northeastern states in 1833 but thereafter lost members, disappearing by the mid 1840s.
The Nullifiers of South Carolina also took off during the first Jackson administration, in response to the tariff of 1828. Its members believed states should be allowed to declare such national laws null and void if they so wanted. Electing 27 House members and 6 senators in the 1830s, the Nullifiers became an important faction as they broke away from the Jackson Democrats to forge a more radical states’ rights political party. Their rivals in South Carolina were called Unionists, a name that in various forms sees a lot of use in the coming decades.
Among the more interesting political parties of the era, the Whigs also grew out of frustration with Jackson, especially his opposition to the national bank and his selection of Martin Van Buren of New York as vice president and preferred successor to the White House. Emerging in the South and the West, the Whigs in 1836 campaigned on a strong federal role in internal improvements but mounted an ineffectual challenge to Van Buren’s presidential candidacy, splitting their own vote among three Whig candidates. They did much better in the midterm elections, claiming 109 seats to Democrats’ 125. The Democrat Van Buren was himself an important figure in the history of political parties, having pioneered the organized use of patronage in New York State and helped build the Jacksonian alliance between “the planters of the South and the plain Republicans of the north.” These strides toward machine politics and cross-sectional cooperation were important steps in the direction of modern political parties.
In 1840, the Democratic party issued the first-ever political party platform, but it was the more transactional and platform-less Whig party that took the White House. As quickly as the Whigs had reached this pinnacle of American government, however, they all but fell apart. President William Henry Harrison died after a month in office, succeeded by John Tyler (the first vice president to replace a president who had died in office), who opposed his own party on the issue of the national bank. President Tyler vetoed his own party’s bank legislation, causing the majority of his cabinet to resign. Tyler became a president without a party and his administration, ultimately, a cautionary tale. Harrison and Tyler are perennials on historians’ lists of America’s worst presidents, another sign of how important parties were not only to electing presidents but to staffing their administrations and carrying out their agendas. In the next election, Democrats crushed the Whigs, who elected just one more president, Zachary Taylor, who also died in office.

In 1853, the Whigs (represented in green) won nearly one-third of the seats in Congress, but by the next election they would disappear from the map.
―The Historical Atlas of Political Parties in The United States Congress: 1789–1989
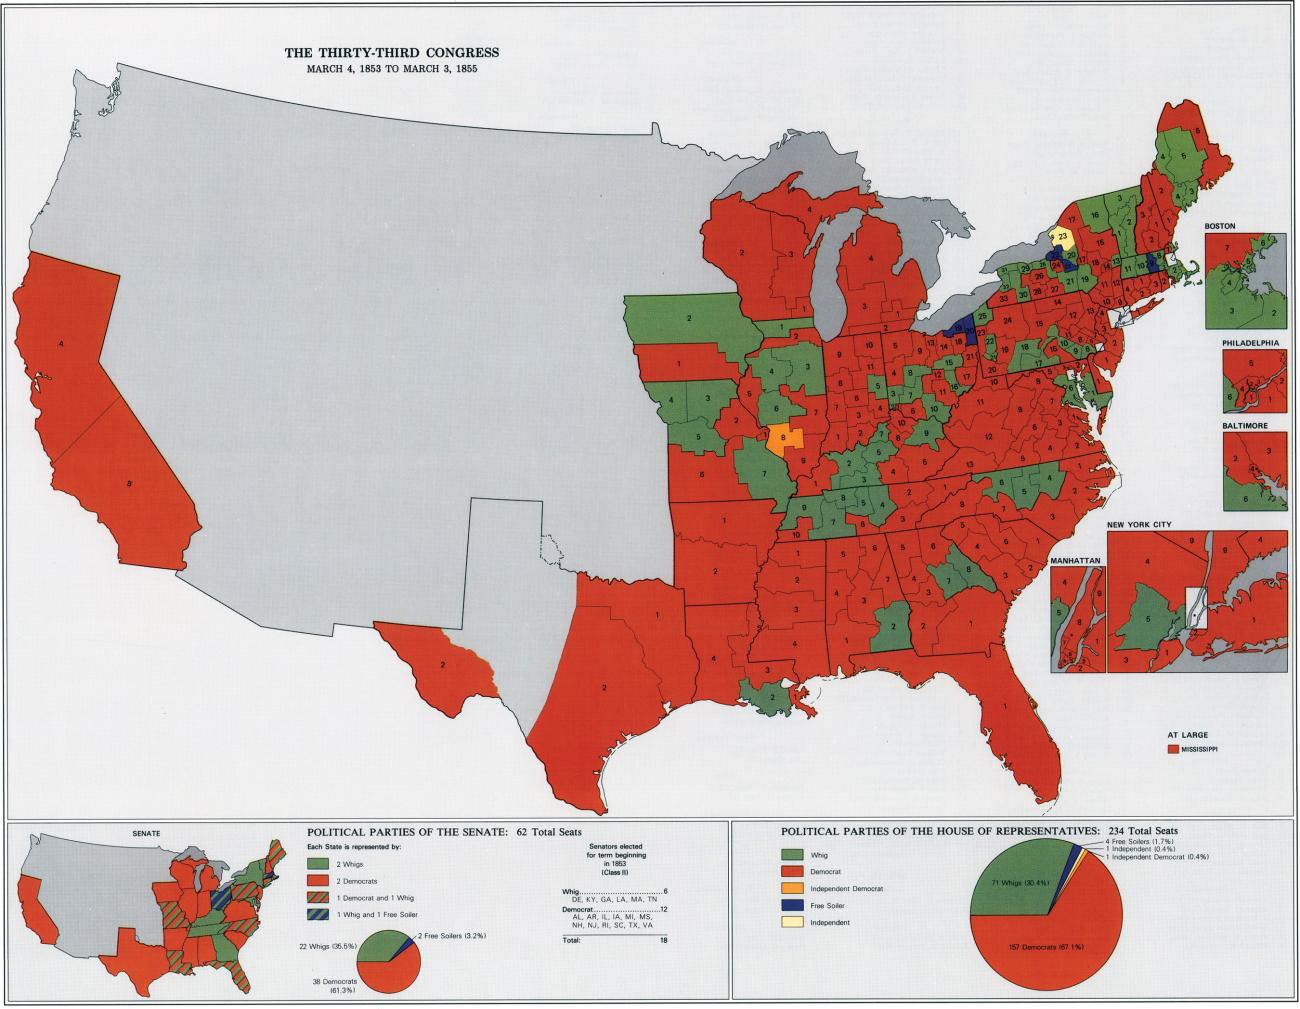
In 1853, the Whigs (represented in green) won nearly one-third of the seats in Congress, but by the next election they would disappear from the map.
―The Historical Atlas of Political Parties in The United States Congress: 1789–1989
The House and Senate remained divided mostly between Democrats and Whigs for several more years, until the elections leading to the 34th Congress, which opened in March of 1855. It’s an important moment in the history of American parties. If you look at the maps for the 33rd and 34th Congresses in The Historical Atlas of Political Parties, you will see why. The Whigs, a minority party with 71 House seats out of 234 in 1853, suddenly vanish. With the next election, they are wiped off the map. Although some Whigs continue to hold office, the name itself quickly fades as immigration and slavery in the western states come to dominate the congressional agenda. Even those elected as Whigs begin calling themselves something else.
In 1855, the American party, also known as the Know Nothings, comes out of nowhere to emerge as the most successful third party in American history, going from zero to 51 House seats in a single election season on the strength of their anti-immigrant agenda. Other anti-Democrat candidates elected to this session present a great muddle of party nomenclature as the whole vocabulary of political parties and political positions shifts and a vast tide of mashed-up names and hyphenates washes slowly over the country. (Elections leading to the 34th Congress were so complicated the atlas contains a lengthy methodological discussion for this one map.)

A mishmash of opposition parties and fusion tickets, including the Anti-Nebraskans and the Know Nothing Whigs, are lumped together in blue on a map of the 34th Congress.
―The Historical Atlas of Political Parties in the United States Congress: 1789–1989
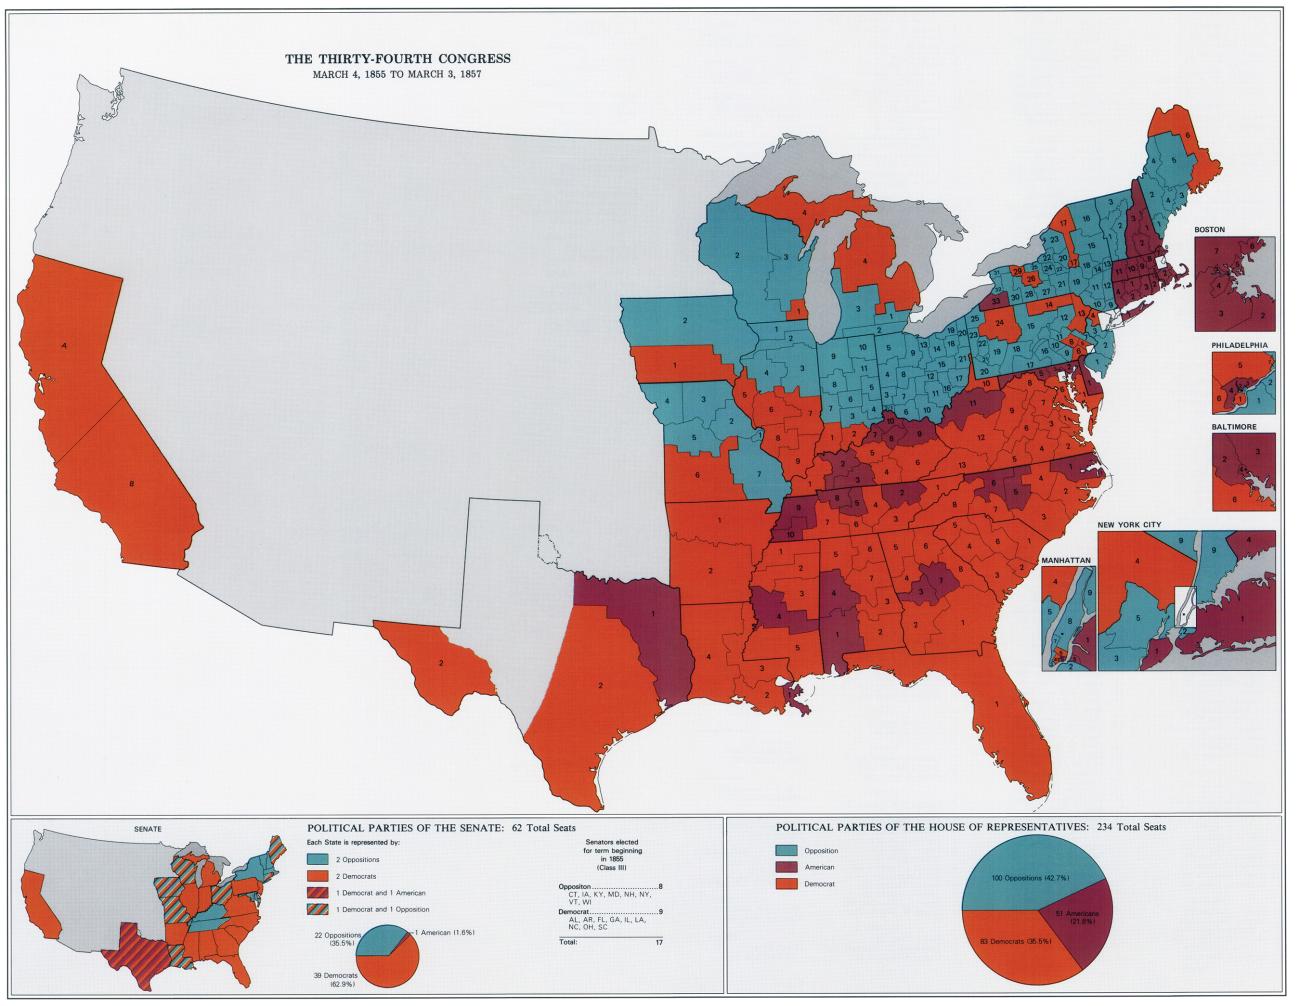
A mishmash of opposition parties and fusion tickets, including the Anti-Nebraskans and the Know Nothing Whigs, are lumped together in blue on a map of the 34th Congress.
―The Historical Atlas of Political Parties in the United States Congress: 1789–1989
Fusion tickets and varying journalistic usage produced oddities such as Know Nothing Whigs and Free Soil Independents as well as Anti-Nebraska and Anti-Administration House members. Except for the Know Nothings or Americans, all of the non-Democrats are lumped together as Opposition by Martis and the atlas, in this instance rationalizing the era’s slapdash application of political labels to better reveal the historical forces at work. Reality catches up with convenience four years later, however, as an actual party called the Opposition party elects several members to Congress.
The 1856–7 election, in which the fusionist Republicans claim 90 seats in the House of Representatives, was a political earthquake. The Know Nothings’ share of seats in the House plummeted, and a year later the Democrats were rent in two by the debate over admitting Kansas to the Union as a slave state. In the next elections, the more disciplined Republicans, representing a mixture of anti-slavery radicals and moderates like Lincoln, expanded their appeal by favoring a tariff and promoting a homestead bill. Republicans won by a large margin but not quite a majority, gaining the greatest share of House seats while setting the stage for the historic 1860 election of President Lincoln and the withdrawal of Southern states from the Union and from Congress.
Such is the breezy version of the story of American political parties up to the Civil War, much of it taken from the highly technical Historical Atlas of Political Parties in the United States Congress: 1789–1989 and its predecessor volume, The Historical Atlas of United States Congressional Districts: 1789–1983, published in 1982.
Before Ken Martis launched these projects, the history of Congress and of political parties could not be told in exacting detail because so much information about individual districts and members was missing, contradictory, or even wrong. Key reference works such as the Biographical Directory of the American Congress, 1774–1971, and the Congressional Directory suffered lapses of editorial standards that led to erroneous identifications, which filtered into histories written for larger audiences. How Martis came to set much of the record straight is a tale of gritty pre-digital research and an important breakthrough in the history of political maps, including those red and blue maps that, starting with the 2000 presidential election, have come to symbolize Americans’ seemingly binary political identities and their intractable polarization.
Ken Martis was not a very promising student at the University of Toledo. “I almost flunked out my first semester,” he says. Then he walked into a geography class.
His parents had bought him a globe when he was eleven, and he had always liked the subject, but this was different. While other classes expressed meaning in words or numbers, geography translated the world into pictures or, rather, maps. It worked for Martis. He became a more focused student and started to wonder if one day he could even teach geography, maybe in a high school.
In 1968, he graduated. He volunteered for the Army and was in advanced ROTC but was given a two-year extension to work on a master’s degree in geography at San Diego State. In uniform he was a second lieutenant in the military police and sent to Fort Bragg to work with the Fifth Special Forces Group. He was never shipped to Vietnam, and Special Forces began pulling out of the war in 1971.
Free to continue graduate school, Martis began studying political geography at the University of Michigan. For his dissertation, he decided to map roll call votes on environmental issues from the first Congress through the 1960s. Visiting the renowned University of Michigan library, he asked a librarian for books and maps on old congressional districts.
“We stood at the card catalog for what seemed like a long time,” he wrote in a memoir. The librarian, stumped, could not find anything that answered his request. Confident something would turn up, she told Martis to come back the next day.
When Martis came back, the librarian and the head of the reference department were waiting for him. They said the library staff had been searching high and low for eighteenth- and nineteenth-century congressional maps but had not found any. Not a single one.
“Wait a minute,” he said, “if I came to the reference desk and asked for the location of Abraham Lincoln’s congressional district when he served in the House of Representatives, you could not find it?”
Indeed, they could not. “We believe there is no reference or maps,” they said, “identifying the location of historical congressional districts and members of Congress.”
Martis soon hit upon a couple leads. Starting in the 1890s, the Congressional Directory began including district maps but not for urban areas. And a month after his momentous visit to the library he heard about a project at the Inter-university Consortium for Political and Social Research, also in Ann Arbor, digitizing all congressional roll call votes. Early data had recently come to ICPSR from a WPA project in the Congressional Vote Analysis Unit of the Historical Records Survey. This older collection, from a project that had started in 1936 and been mothballed at the beginning of World War II, included a never-completed plan to collect roll call votes and map them.
The WPA project was surprisingly ambitious—it would have made an encyclopedia salesman laugh. Proposed by Clifford L. Lord, a history instructor at Columbia University, to Luther H. Evans, the first director of the Historical Records Survey, the goal of the project was to map all 54,000 roll call votes taken since the beginning of the first Congress. Every last yea and nay was to be mapped and printed.
“Columbia University Press,” according to a journal article written by cartographer Ruth Anderson Rowles and Martis, “planned to publish the atlas in forty-one volumes, totaling 33,000 101/8-by-131/8-inch pages.” These large-format volumes were to be clothbound and gold-stamped.
At its height the project had employed 350 people and was making significant progress. Votes were indexed. Every bill was analyzed and written up in a paragraph-long summary. The WPA project also included research into eighteenth- and nineteenth-century redistricting laws setting boundaries for individual congressional districts. This last material, along with the project’s collection of state maps, proved the most valuable to Martis.
The idea of mapping votes had been little explored before the turn of the twentieth century when historian Frederick Jackson Turner began looking to maps to explain sectional differences in American politics, differences that often defied party labels. (Turner is best known for his “frontier thesis,” controversially arguing that American character and democracy had been forged by Americans’ experience with the westwardly receding frontier.) His doctoral student Orin G. Libby delivered an address in 1896 to the American Historical Association called “A Plea for the Study of Votes in Congress,” which featured maps of roll call votes on tariffs. Turner himself pursued this general line of thought and would go on to influence others, including Luther Evans, Clifford Lord, and, of course, Ken Martis.
Martis was a first-year professor at West Virginia University when, in 1977, he applied for the first of two NEH grants “to compile for the first time complete Congressional district boundary maps for all 95 Congresses in the history of the U.S.” The grant covered his research expenses as he worked at the National Archives and the Library of Congress. It also paid for a legal secretary and a small staff of assistants who wrote letters and called libraries and archives across the country for information on district boundaries, which, thanks to population growth and redistricting, changed with time. And it enabled Martis to hire Ruth Anderson Rowles, his most important collaborator, who supervised the entire map design process.
The Historical Atlas of United States Congressional Districts was the first atlas to map all the congressional districts and the first to identify all the members of Congress with their correct district locations going back to 1789. It won major prizes, including the prestigious Waldo G. Leland Prize from the American Historical Association for the best reference book in all fields of history for the years 1981 to 1986. It has been a key resource for newer projects such as Digital Boundary Definitions of United States Congressional Districts, 1789–2012. And it laid the groundwork for The Historical Atlas of Political Parties, which, among other laurels, became the centerpiece of a 1989 exhibition at the Library of Congress celebrating the two hundredth anniversary of the United States Congress.

Martis’s extensively researched and award-winning atlases are still widely cited today.
―Courtesy of Ken Martis

Martis’s extensively researched and award-winning atlases are still widely cited today.
―Courtesy of Ken Martis
The Historical Atlas of Political Parties drew on the base maps of Martis’s prior atlas and collected its own list of firsts: first to map all congressional elections—more than 31,000 of them; first to identify the political party affiliation of every person, more than 11,000 individuals, elected to Congress from 1788 to 1989. The party affiliation data so exceeded the quality and standards of earlier sources that it became the standard source for the official Biographical Directory of the United States Congress. Martis says many if not most Wikipedia articles on congressional districts cite his two atlases.
One difference between the maps in Martis’s atlas of political parties and the political maps of the last couple of decades is their color: Back in 1989, Martis used red for Democrats and blue for Republicans, which was more common at the time as red and blue were still widely associated with left and right, respectively. More interesting to him, however, are all the things you can do with maps, like illustrating geographic patterns in roll call votes and illustrating voter behavior in national elections.
Interviewed in his office at West Virginia University, Martis, now retired, smiles as he describes the reactions of people to whom he has shown his work. Just as he had, as an undergraduate, found maps to be revelatory, so too have audiences who have seen him discuss maps of American politics past and present. It’s always a pleasure to see, he says. The eyes widen, a light goes on in the brain, and the truth is newly apparent. Martis remembers giving a presentation at an academic conference many years ago. David Broder, dean of the Washington press corps, was there. “I have been writing about this for thirty years,” Broder said after seeing the congressional election maps, “and it’s like you are showing it to me for the first time.”
