Skip to main content
The National Endowment for the Humanities
Close
Grants
Divisions and Offices
Grants Search
Manage Your Award
NEH's Application Review Process
Professional Development
Grantee Communications Toolkit
NEH Virtual Grant Workshops
Our Work
Awards & Honors
American Tapestry
Humanities Magazine
NEH Resources for Native Communities
Search Our Work
Events
About
Office of Communications
Office of Congressional Affairs
Office of Data and Evaluation
Budget / Performance
Contact NEH
Equal Employment Opportunity
FOIA
History
Human Resources
Information Quality
National Council on the Humanities
Office of the Inspector General
Privacy Program
State and Jurisdictional Humanities Councils
Office of the Chair
News
Office of the Chair
American Tapestry
NEH-DOI Federal Indian Boarding School Initiative Partnership
NEH Equity Action Plan
Twitter
Facebook
YouTube
Instagram
GovDelivery
The National Endowment for the Humanities
Grants
News
Our Work
About
Search
Search this Section
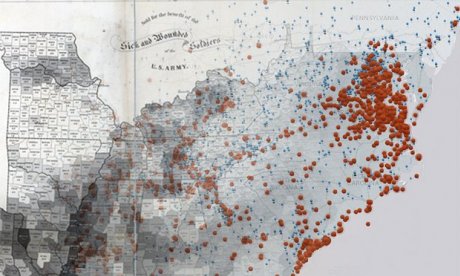
Visualizing Emancipation Map 1
Image